Simugraph Viewer 2.0
- by Lucas
- 4 upvotes
- Downloaded 53 times
Description


This script allows you to visualize a Cooked Simugraph using a .copy file exported from a Simugraph asset.
before using this tool make sure to download Graphviz
What you can see:
- Connection beteween each nodes and each pins
- Names of all nodes in the original simugraph
- Type of nodes
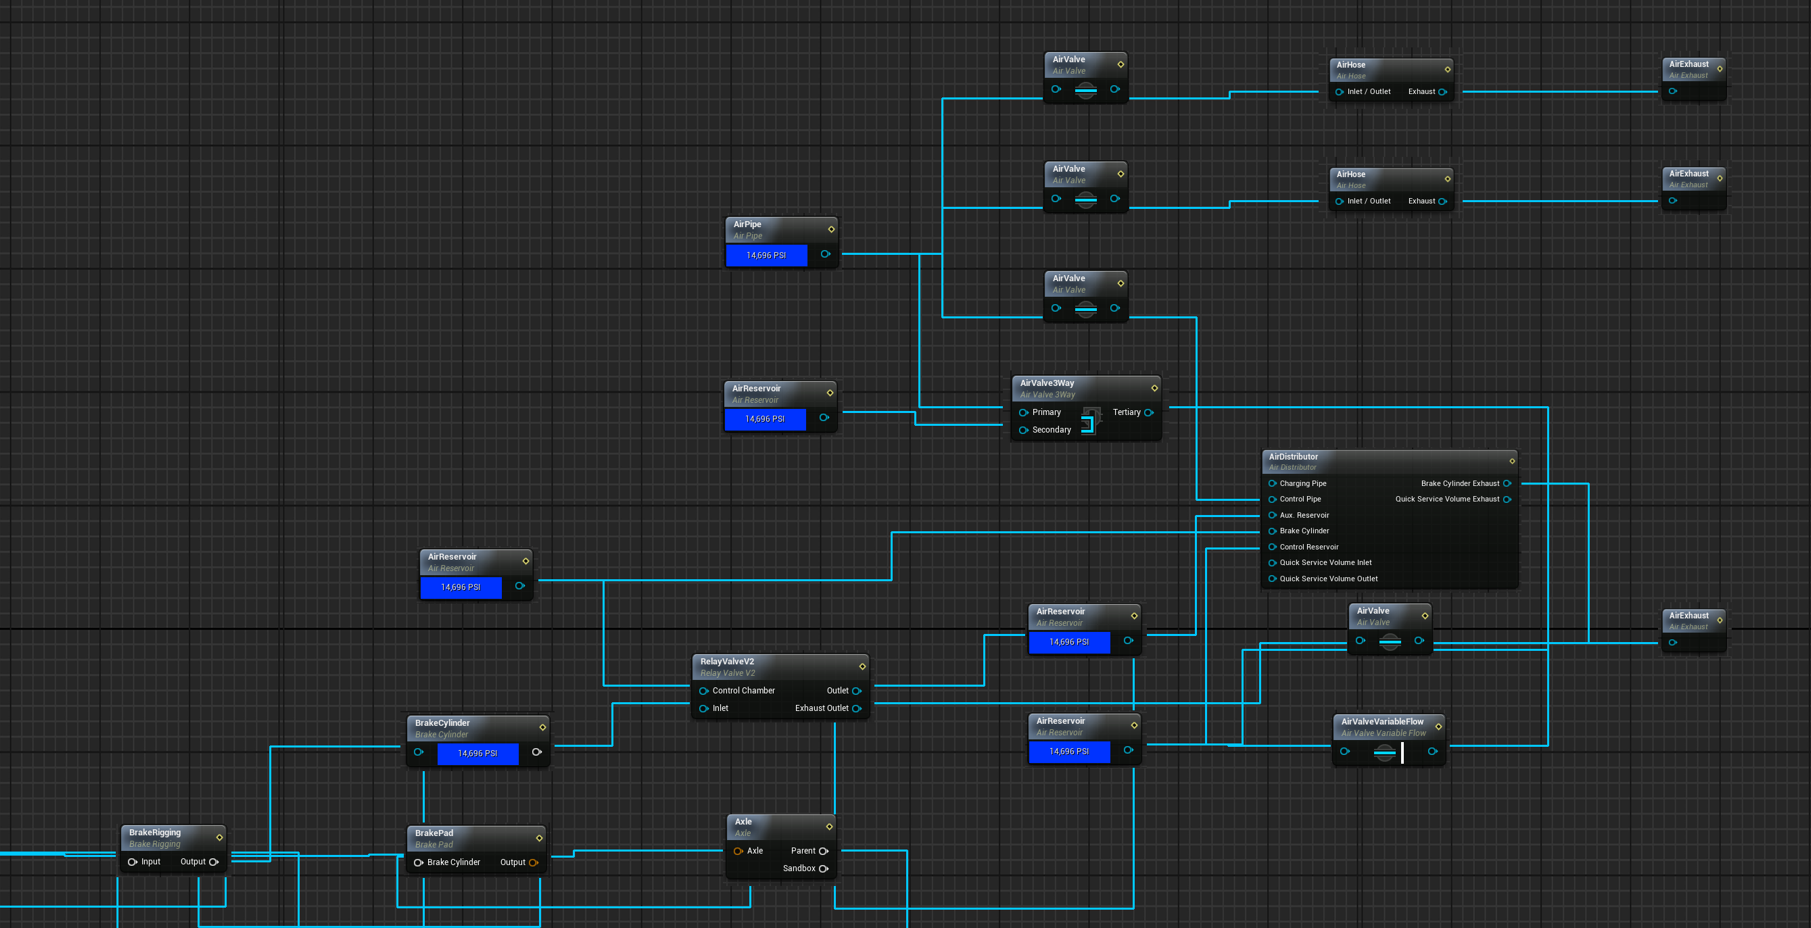
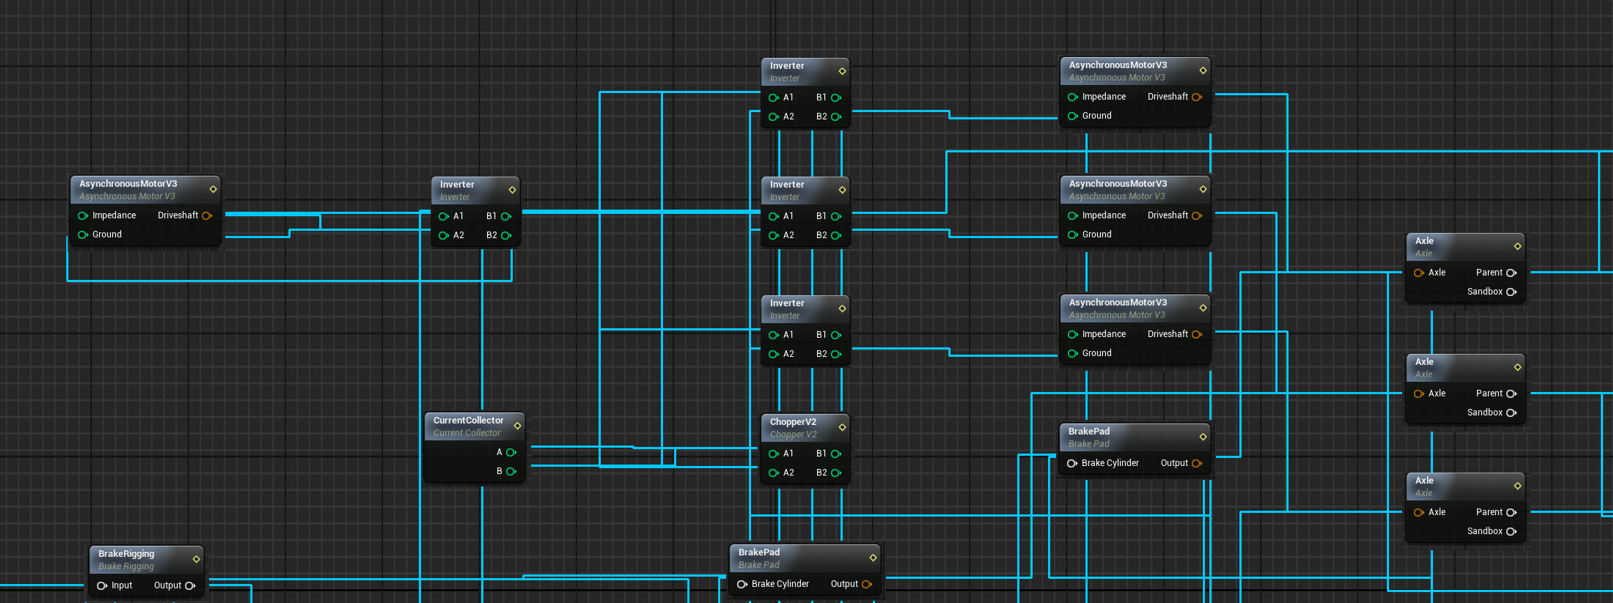
Simugraph systems that are otherwise difficult to interpret once cooked, It is especially useful for analyzing overall architecture, understanding node relationships, and studying how different components interact within a system.
This tool is therefore intended for beginners, to help learn and better understand DTG methods, especially when dealing with complex cooked assets.
Exemple of simugraph done by the tool:
Warning
Important Note: This is NOT a Simugraph Decooker!
Why isn’t it?
Simply copying each node will not produce the same result: some parts require additional parameters and custom logic to function correctly.
I am not responsible for any issues or failures resulting from its use.
With this tool, you cannot see values, curve, or the connections of value expression nodes and value converters.
(Connections cannot be displayed for signal converter nodes.)
And its an image, not a .uasset, its not displayed in the editor as a new simugraph blueprint
Tags: cook cooker decook decooker editor simugraph simulation tools unofficial-editor viewer
Dependencies
Download
GraphvizSource Code Source code packages for the latest stable and development versions of Graphviz are available, along with instructions for anonymous access to the sources using Git.
Executable Packages Packages marked with an asterisk(*) are provided by outside parties. We list them for convenience, but disclaim responsibility for the contents of these packages.
Linux Precompiled binaries are available attached to releases on Gitlab, https://gitlab.com/graphviz/graphviz/-/releases. You may also find it useful to try one of the following third-party sites.
Installation Instructions
Installation:
Install the Graphviz (dot) library here: https://graphviz.org/download/
Add Graphviz to PATH.
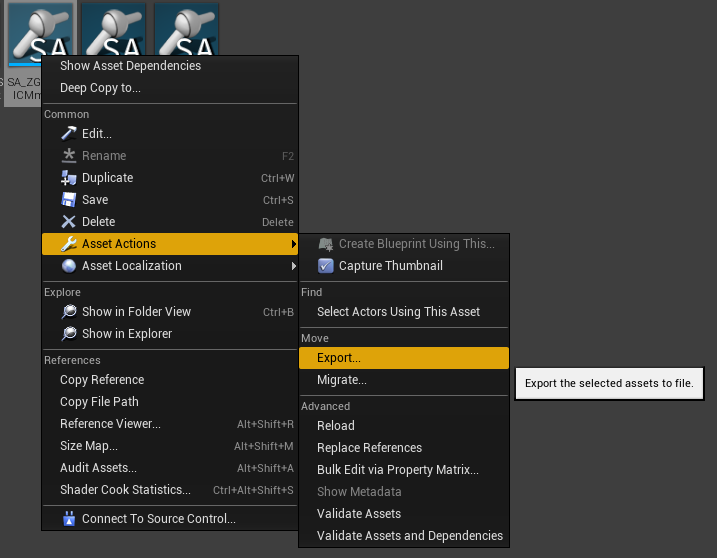
First, go in the editor, search your simugraph, hit right click -> asset action -> export. Save it in the somewhere (in the same folder of this mod will be better)
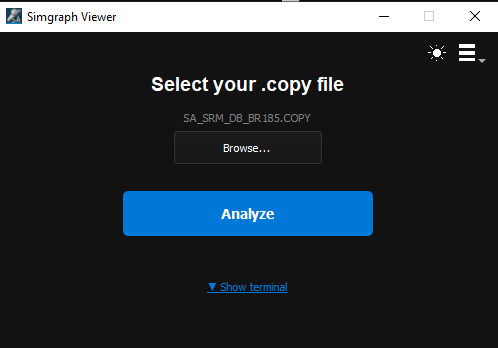
Then Start the Simugraph Viewer, click on Browse, hit Analyze and thats it ! (the image will automaticly open and it will be save in /output)
Additional Comments
**Note: ** After extracting the .rar, keep all the folder and files in the same directory, dont mix them.
UPDATES: 06/05/2026
Added a fresh new GUI, replacing the old console
Added full image-based node rendering replacing abstract graph visualization
Introduced PNG node assets support for accurate visual representation
Implemented JSON-driven pin positioning system for precise wiring
Enabled dynamic wire routing with collision avoidance
Added left/right pin logic to enforce graph directionality
Improved layout coherence using Graphviz with fallback to spring layout
Introduced background grid rendering with optional image tiling
Added bounding box detection to prevent wire overlap with nodes
Implemented multi-segment wire paths for cleaner connections
Added support for pin-based edge direction correction
Improved parsing of blueprint text into structured graph data
Added automatic canvas scaling based on graph size
Introduced fallback behavior for missing node images
Added fallback pin positioning when JSON data is incomplete
Improved visual readability compared to original Simugraph viewer
Reduced wire clutter through spatial routing constraints
Separated assets, config, and output into structured directories
Enabled compatibility with compiled executable environments
Improved error handling during JSON loading and parsing
Clarified node type usage via SimulationNode naming convention
UPDATES:
Update 27.01.26
Pin names are automatically loaded from a configuration file
Support for 80+ node types
Top-to-bottom graph layout
Orthogonal (right-angle) edges
Automatic spacing based on graph complexity
Files
v2.0
Comments
About this mod
- Created
- 25 Jan 2026
- Updated
- 7 May 2026
- Game
- Train Sim World
- Type of content
- Utility
Loading comments…